
Every year, attendees at Esri’s User Conference (UC) in San Diego eagerly anticipate the release of the Esri® Map Book, the collection of maps that Esri annually selects to showcase how digital geography is helping governments, businesses and citizens to understand and sustain our world. Chosen from among thousands of works of mapmakers worldwide, the maps included in the Esri® Map Book represent powerful and creative examples of geographic information science (GIS) technologies, spatial analysis and spatial data visualization. After attendees pick up their registration badges in the San Diego Convention Center, they swing through the section with UC swag to get their copy of the Map Book. It’s not unusual to see UC registrants stopping in the registration area to flip through the Map Book and admire the maps that Esri has deemed exceptional.
This year when the UC officially opened on Monday morning, July 13, 2020, participants in the inaugural virtual UC got their first look at this year’s Esri® Map Book Volume 35 as it was released in a digital format. The Spatial Sciences Institute (SSI) is pleased to share that this year’s Esri® Map Book includes maps by two SSI students and one by an alumnus.
 The maps “The Spatial Dynamics of Amazon Lockers in Los Angeles County” by Jiawen Fang and her professor, An-Min Wu, describe and explain the spatial dynamics of Amazon Hub Lockers in Los Angeles (LA) County using various spatial analysis tools. Fang and Wu detected a clustered pattern and a positive significant spatial autocorrelation, indicating that the spatial interaction between nearby places plays an important role in locker distribution. Six demographic variables are considered as factors that might affect the locker distribution. They found that education and population have dominant influence in northwest LA where educational institutions cluster. Internet use and white population concentration have major effects in southeast LA. Income mainly explains the locker distribution variations in the middle part of LA County.
Fang is Ph.D. student in urban planning in the USC Price School of Public Policy and in the doctoral certificate program in Spatial Analytics in the USC Spatial Sciences Institute. Fan conducted this research in the spring 2019 course SSCI 683: Principles of Spatial Data Analysis taught by Wu, SSI lecturer of spatial sciences.
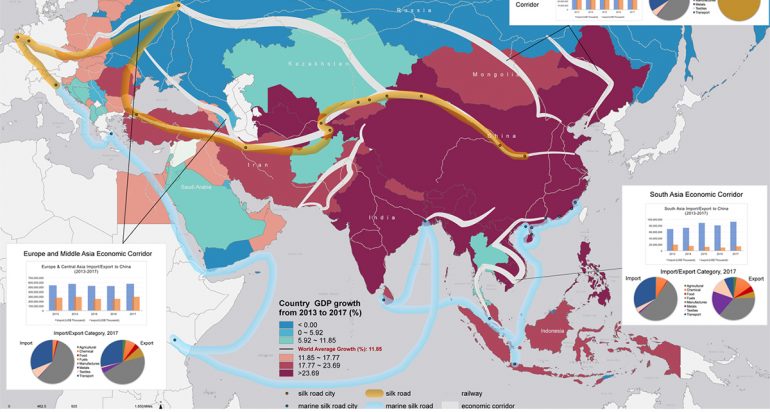
Xin Yu 's map “The 21st Century Silk Road: The Economic Impact of The Belt and Road Initiative (BRI) from 2013 to 2017” focuses on the routes along the 21st Century Silk Road (or the Belt and Road Initiative) and the economic and trade development trend of involved countries from 2013 to 2017. Her map shows three economical corridors as examples to show the total import and export to China and the distribution among categories. Yu constructed the map as a final project in SSCI 589: Cartography and Visualization with Katsuhiko Oda, Ph.D., SSI assistant professor (teaching) of spatial sciences.
Yu graduated from SSI’s M.S. in Spatial Data Science program in 2019 and currently is a Ph.D. student in the USC Population, Health and Place doctoral program.
Both Fang and Yu presented their maps at last summer at the 2019 Esri UC in San Diego.
This year’s Esri® Map Book also includes a map by Gregory Elwood, who graduated in 2009 from the USC Geography Department, the predecessor unit to the Spatial Sciences Institute. Elwood’s “Ventura County Fire Department Station 46 Wall Map” is a resource for the Ventura County Fire Department, which provides fire, rescue, and emergency medical services to the unincorporated areas of Ventura County and seven of its cities. Each of the thirty-three fire stations has a designated area of responsibility known as a station sector. The fire station wall maps are representations of the station sectors and are mounted on a wall in the engine bay. This map was used for Station 46, known as the Tapo Street Station, which serves the north side of the city.
The fire station wall maps are specifically designed to be reference documents for the station personnel. Prominent features include the station location, sector boundary, the location of the adjacent sector stations, fire hydrants and helispots. The transportation network is extensively represented, including freeways, highways, primary and secondary streets, and local streets and alleys. Bike paths and pedestrian walkways as well as hiking trails are included. Physical features in the map include streams, rivers and canals, bridges, buildings and parks and other types of public spaces.
In his foreword, Jack Dangermond, founder and president of Esri, wrote, “I congratulate all contributors to Esri® Map Book Volume 35, whose work inspires us through not only the innovative use of technology but through sharing an understanding and each other’s world.”